December 7, 2003
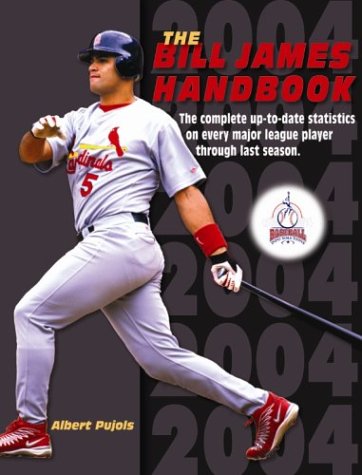
The 2004 Bill James Handbook
I think the best way to describe The 2004 Bill James Handbook is to tell you what my mom thinks of it.
I ordered the book online a little while ago and, for some reason, had it shipped to my mom's house, instead of my dorm room. My mom told me it arrived in the mail a few days ago and then said, "I looked at it and it's all just a bunch of numbers."
Whether or not you think a baseball book that is "all just a bunch of numbers" is a good thing is a matter of personal preference, obviously. I would guess that if you're a regular reader of this blog you will love the book.
It contains just about any stat you could ever want in regard to the just completed 2003 season.
Year-by-year career stats for every player who played in the majors in 2003, including minor league numbers for many players. Detailed team stats and league stats. Tons of defensive stats for every player, at every position. Stats for managers, including how often they pinch-hit, what percent of the time they use platoons and how often they use relievers. Lefty/righty splits for every hitter and every pitcher. Active career batting and pitching leaders in a number of categories. Career and year-by-year Win Shares for all active players. And so much more.
Of particular interest to me is the section called "2003 Leader Boards." It contains the top 10 players in each league for about 1,000 different stats, from the normal (batting average) to the obscure (steals of third base).
I'd like to share with you some of the more interesting tidbits of information I found in the 2003 Leader Boards section of The 2004 Bill James Handbook, along with some of my own comments...


Juan Pierre led all of baseball in singles, with 168. Ichiro! was second in MLB and first in the AL with 162.
Pierre's 168 singles accounted for 82.3% of his hits last season. He also added 28 doubles, 7 triples and 1 homer. Barry Bonds, who was second in the NL in home runs with 45 and was the MVP of the National League, hit 65 singles. They accounted for just 48.8% of his hits.

Jason Giambi led the AL in walks (129), strikeouts (140) and times hit by pitch (21). He was also fourth in the AL in homers with 41.
Giambi played in 156 games and came to the plate 690 times last year. That means he did something other than stroll to first base, back to the dugout or around the bases in just 52.0% of those plate appearances. Not surprisingly, Giambi also led the AL in total pitches seen, with 2,913.


Milton Bradley hit .402 against left-handed pitching, leading the AL. He also led the AL with a .500 OBP against southpaws. Manny Ramirez was second in the AL in both stats, checking in at .385 and .476. Frank Thomas led the league in slugging percentage versus lefties at .732.
Barry Bonds led the NL in OBP versus lefties (.509), OBP versus righties (.537), slugging percentage versus lefties (.790), and slugging percentage versus righties (.729).

Tampa Bay right-hander Victor Zambrano led the AL in walks allowed (106), hit batters (20) and wild pitches (15). When he wasn't walking them, hitting them or bouncing a pitch to the backstop, batters hit just .238 against Zambrano, no doubt because they were scared for their lives.


The AL "leaders" in losses:
Mike Maroth (DET)         21

Jeremy Bonderman (DET)    19

Nate Cornejo (DET)        17
Those three combined to make 93 of Detroit's 162 starts, pitching a total of 550 innings. They went 21-57. Amazingly, their .269 winning percentage was better than the rest of Detroit's pitching-staff, which went 22-62 for a .262 winning percentage.


Just five AL hitters who qualified for the batting title had an on-base percentage of at least .400. Over in the NL, 10 hitters had an OBP of at least .400, including Barry Bonds at .529.
Alex Rodriguez was the only AL player with a slugging percentage of at least .600 and he was at exactly .600. In the NL, five players slugged at least .600, led by Barry Bonds at .749.
Bonds' .529 OBP would have ranked 14th in the NL in slugging percentage.

The highest on-base percentage by a leadoff hitter in the American League came from Jerry Hairston Jr., who had a .389 OBP in 201 plate appearances leading off.
In the NL, Marquis Grissom, who drew a total of 20 walks all year, led in OBP by a leadoff hitter with a .412 OBP in 167 plate appearances there. As a leadoff-man, Grissom drew a walk every 13.9 plate appearances. Batting everywhere else in the lineup, he walked once every 56.4 plate appearances.


Of the top 10 AL hitters in batting average against right-handed pitching just two of them, Magglio Ordonez and Carlos Lee, hit right-handed. The top eight guys all hit left-handed (including Bill Mueller, who is a switch-hitter).
Of the top 10 AL hitters in batting average against left-handed pitching, Ichiro! is the only lefty and he hit .359 against them.

The Official Pitcher of Aaron's Baseball Blog, Johan Santana, led the AL with an .800 winning percentage.
Johan only threw 158.1 innings this year, narrowly missing the 162-inning cutoff for being included in all the pitching leader boards. Had he reached that mark, here is how he would have ranked among AL pitchers in various categories:
Earned Run Average            4th

Opponent Batting Average      2nd

Baserunners Per 9 IP          3rd

Strikeouts Per 9 IP           2nd

Opponent OBP                  2nd

Opponent SLG                  6th

Strikeout to Walk Ratio       7th
Johan also held opponents to a .165 batting average with runners in scoring position, the best in the AL. He was fifth among all pitchers in opponent batting average versus lefties (.191) and 10th in opponent batting average against righties (.227).


Which AL pitcher threw the most pitches per start this year? I think most people would probably guess Roy Halladay, who led the AL in innings, games started, batters faced and wins. Actually though, Halladay didn't throw all that many pitches per start, mostly because his 3.39 pitches per batter ranked second to only David Wells for fewest in the AL.
In fact, Halladay, who totaled 266 innings this year and threw an average of 7.4 innings per start, isn't even among the top 10 for most pitches per start in the AL.
The leader? Joel Pineiro, who threw an average of 109.2 pitches in his 32 starts for Seattle. Pineiro had a good year, going 16-11 with a 3.78 ERA in 211.2 innings, but the fact that he led the league in pitches per start is both surprising and a little disturbing. After all, Pineiro was just 24 years old.
109.2 pitches per start is getting extremely close to A.J. Burnett-territory. Burnett, also known as The Official Injured Pitcher of Aaron's Baseball Blog, threw an average of 109.5 pitches per start in 2002, on his way to Tommy John surgery.
Pineiro threw at least 110 pitches in 17 of his 32 starts (53%) and threw 120+ in five of them (16%). Perhaps not surprisingly, Pineiro faded badly in the second-half of the year, going 5-6 with a 4.57 ERA after the all-star break, following a 11-5/3.28 first-half.


While Joel Pineiro led the AL in pitches per start and has been in A.J. Burnett-territory as far as workload for a young pitcher is concerned, there are two right-handers in Chicago who blow Pineiro and Burnett out of the water.
Mark Prior led the NL in pitches per start with 113.3 and Kerry Wood was second at 110.7.
Cubs manager Dusty Baker had a reputation for working his starting pitchers very hard in San Francisco, and he certainly lived up to that in his first season with Chicago. Along with Prior and Wood ranking 1-2 in the league in pitches per start, Carlos Zambrano also ranked 7th. Prior and Zambrano were each 22 years old last season and Kerry Wood is 26, but already has a significant elbow injury under his belt.
As I have said on this blog many times, I think Mark Prior will go down as one of the greatest pitchers in the history of baseball. So, in that respect, I can understand Dusty Baker wanting to have him on the mound to throw as many pitches as possible. And, obviously, riding Prior so hard worked out fairly well for the Cubs last year.
In the long-run though, I don't see how anyone can justify letting a 22-year old pitcher in his first full-season throw 113.3 pitches per start. Prior threw at least 100 pitches in 26 of his 30 starts (87%) and threw 110+ pitches in 20 of his 30 starts (67%).
Consistently going beyond the 110-pitch mark is the point at which I start to have concerns and Prior did that constantly last year. The really disturbing thing is that he threw 120+ pitches in nine of his 30 starts (30%), including nine of his final 23 (39%) of the year.
Wait, it gets worse. Prior threw at least 130 pitches in a start on three occasions, plus an additional 133-pitch start in the playoffs. If you count his three post-season starts, Prior's pitch-counts in his last dozen starts look like this:
118
100
116
131
129
110
124
131
133
133
116
119
That is an average of 121.7 pitches per start over the course of about three months, which is just crazy. I am particularly appalled by the back-to-back-to-back starts in which he went 131, 133 and 133 pitches.
There is some reason to believe Mark Prior is a freak of nature, a person simply built for throwing a baseball. His delivery is picture-perfect, his incredible velocity and movement seem to come with relative ease, and he has the size and strength that scouts drool over. I am, of course, hoping that Prior, being the freak that he is, can withstand whatever massive pitch-counts he is going to face as long as Dusty Baker is his manager.
Baker let Prior, at 22 years old, throw 121.7 pitches per start over the last three months of this season. Prior will be a year older next season, and now Dusty knows him better and knows just how great he can be. Can you imagine how many 130-pitch games Prior is going to have next year?
As baseball fans, I think we should all pray for Mark Prior's right arm. And you might want to say a little something for Wood and Zambrano too, as long as you're at it.


Scott Hatteberg led the AL in percentage of pitches taken, doing nothing but stare at 66.9% of the pitches he saw. Erubiel Durazo was the only other Oakland hitter was in the top 10. Three Yankees (Nick Johnson, Jason Giambi, Hideki Matsui) ranked 4th, 6th and 7th. The Official Red Headed Switch-Hitter of Aaron's Baseball Blog, Bobby Kielty, took 61.4% of his pitches, ranking 9th in the league.
In the NL, Barry Bonds led in percentage of pitches taken, with 65.9%. I'm not sure if intentional balls are counted as "pitches taken," but Bonds saw 244 of them, which would boost up that percentage quite a bit.


Bonds led the NL with a 1.393 OPS against fastballs.
Going along with the theory that curveballs don't curve as much in Colorado, Rockies Jay Payton and Todd Helton ranked 1-2 in the NL in OPS against curveballs and another Rockie, Preston Wilson, ranked fifth. Going along with the theory that if you throw him a curveball Gary Sheffield will hit it really hard, Sheffield led all non-Rockies in OPS versus curves at 1.043.
Trot Nixon led the AL with a 1.184 OPS against fastballs. Minnesota's catching-duo of A.J. Pierzynski and Matthew LeCroy led the AL in OPS against changeups, at 1.111 and 1.106, respectively. Ron Gardenhire has often referred to LeCroy as "softball Matty," so maybe he's onto something.


Greg Maddux threw 64.4% of his pitches for strikes in 2003, which surprisingly was good for only second-place among NL starters. Kevin Millwood ranked first, throwing 65.3% of his pitches for strikes.
Along with Millwood ranking first, Philadelphia pitchers Vincente Padilla and Brett Myers ranked 4th and 5th in the league. I'd like to hear Philadelphia pitching coach Joe Kerrigan's ideas on throwing strikes, because I think it's pretty obvious he got his pitchers to do that last year.
Of course, in addition to getting them to throw strikes, Kerrigan also got them to forget all about the running-game. Kevin Millwood allowed 41 stolen bases last year and just four runners were thrown out trying to steal against him. That means they went 41/45 (91.1%) against him, which is just crazy.
Overall, the Phillies allowed 112 stolen bases last year at an 82.3% clip, which is incredible, although not all that unexpected. I remember Kerrigan had his pitchers pay similar attention to the running-game while with the Red Sox.

Speaking of Philadelphia letting teams run at will, I think their starting catcher, Mike Lieberthal, is a perfect example of why looking a catcher's "throw-out rate" is more than a little misleading.
Lieberthal threw out just 18.4% of the runners who tried to steal a base against him this season. That is a really awful percentage and it would lead you to believe Lieberthal is a poor-throwing catcher. It would lead you to believe that, but nothing could be farther from the truth.
Check out Lieberthal's throw-out rates prior to 2003:
1996     36.4

1997     34.8

1998     35.3

1999     32.0

2000     39.7

2001     35.7

2002     35.4
Prior to this year, Lieberthal had a career throw-out rate of 34.0%. To put that into some context, the best rate among regular catchers in the NL this season was 38.2%, by Damian Miller.
Like most things in baseball, things aren't always as black and white as they first appear. A catcher's throw-out percentage is a good example of that.

To me, the most interesting group of stats found in The 2004 Bill James Handbook is the charting of pitches. The book includes the leaders in such things as average fastball velocity, percentage of curveballs thrown, pitches less than 80 MPH and lots more. I hadn't seen such information before and this type of stuff is really intriguing to me.
For example, in the entire American League last season, only 26 pitches were thrown at least 100 miles per hour. 12 of those 26 were thrown by Bartolo Colon, who led the league.
Meanwhile, over in the NL, a total of 179 pitches were thrown at least 100 MPH. Why the massive difference between the two leagues? Two words: Billy Wagner.
Wagner, a lefty who claims to be 5'11" and 195 pounds, threw 159 pitches at least 100 MPH last season. All other major league pitchers threw 46, combined.
More than any stat in this book (and there are a TON of them), that one blew me away the most. As a closer, Wagner threw a total of just 1,315 pitches last year. That means 12.1% of them reached triple-digits. Bartolo Colon, whose 12 100+ MPH pitches ranked second in all of baseball, reached triple-digits on 0.3% of his pitches.
I can't even put into words how amazing that is to me.
The book also lists the league leaders in pitches of at least 95 miles per hour. Kerry Wood led the NL with 1,138 and Colon led the AL with 636. What is missing from the book is a list of the guys who threw the highest percentage of their pitches 95+. The raw totals are interesting, but I'd be more interested in the percentages.
For example, Wood's MLB-leading 1,138 pitches of 95+ last season accounted for 32.1% of his total pitches for the year. That number seems really impressive, until you do a little number crunching and find that Wagner threw 58.2% of his pitches at least 95 MPH.
Honestly, with all due respect to Barry Bonds, I don't think there is a more amazing baseball player on this planet than Billy Wagner.
The 2004 Bill James Handbook is a must-have for any serious baseball fan. If I could make one suggestion for next year's book, it is that they add even more stats and even more categories. Specifically, I think it would be great for them to add "trailers" for all the stats, in addition to the leaders.
In other words, it's fun to know that Barry Bonds led the NL in Isolated Power or that Scott Hatteberg took the highest percentage of called pitches in the AL or that Milton Bradley led the AL with a .402 batting average against lefties or that Jay Payton led the NL in OPS versus curveballs. At the same time, I want to know who was on the other end of the spectrums too.
Who had the lowest Isolated Power? Who swung at the highest percentage of pitches? Who stunk the most against left-handed pitching? Which guys can't hit curveballs? The possibilities are endless.
If you haven't already, I highly suggest you get yourself a copy of The 2004 Bill James Handbook. It is reasonably priced at $19.95 and it is even cheaper at Amazon.com, where you can grab it for just $13.97.
If you are interested in the book and would like to order it online, I would love it if you would use the following link to do so:
If you click on the above link to the book and purchase it for $13.97, I get a 5% commission. 70 cents per book might not sound like much, but if 20 of you click on that link and buy it, I get my copy for free!
*****Comments? Questions? Email me!*****


