September 23, 2003
The 2003 Aaron's Baseball Blog Awards: Cy Young
In yesterday's entry, I made my picks for American League and National League Rookie of the Year, and also shed a little light on how I go about making my award selections:
"When I decide how I would vote for these awards, I do so by asking myself one very simple question in each and every instance...
Who has been the best _____ in the league this season?
It's short, it's simple and it's to the point. And it works for every award.
For the MVP, insert "player." For the Cy Young, insert "pitcher." For the Rookie of the Year, insert "rookie." It even works for lesser awards. Basically, you name the award, and I can fit something into that blank space to make that one sentence work."
As I discussed yesterday, I think the voting for the MVP has shifted in recent years and is at a point now where the award is not given to the best player in the league, but to the best player on a contending team. In my opinion, that is faulty logic, because the best player is the Most Valuable Player, regardless of how his teammates (and his team) perform.
The Cy Young Award seems to have avoided that same shift, for the most part at least. The Cy Young voters seem to give the award to the pitcher they feel has been the best in the league, regardless of whether or not his team is a good one. Of course, they often misidentify that best pitcher, but that's another story. I'm a little dumbfounded as to why team performance seems to be a very minor factor for the Cy Young and a major factor for the MVP, but I suspect it has a lot to do with allowing different people to have different theories on the meaning of "valuable." To me, the Cy Young award is really the MVP for pitchers - the Most Valuable Pitcher, I guess.
Okay, enough with the introduction, on with the awards...
American League Cy Young:


1) Tim Hudson, Oakland A's
2) Roy Halladay, Toronto Blue Jays
3) Pedro Martinez, Boston Red Sox
4) Esteban Loaiza, Chicago White Sox
5) Mike Mussina, New York Yankees
                    VORP                         Win Shares

Pedro Martinez      69.9        Tim Hudson          22.10

Esteban Loaiza      69.9        Roy Halladay        22.00

Tim Hudson          67.0        Esteban Loaiza      21.67

Roy Halladay        64.7        Keith Foulke        20.81

Mike Mussina        55.1        Mike Mussina        19.74

Mark Mulder         53.4        Pedro Martinez      19.11

Jamie Moyer         50.6        Mariano Rivera      16.87

Bartolo Colon       50.4        Mark Mulder         16.84

Barry Zito          50.2        Darrell May         16.80

Johan Santana       47.6        Barry Zito          16.65
In my mind, there are four legit contenders for the AL Cy Young this year, maybe even five if you want to include Mike Mussina in the discussion. But before I start breaking down those four main contenders, I want to throw a little recognition to both Mark Mulder and Johan Santana.
Mulder hasn't started a game since August 19th and yet he's still going to finish the year among the top 10 pitchers in the American League. He has a VORP of 53.4 in 26 starts, which works out to 2.05 per start. If you project that to a full-season's worth of starts up until this point - let's say 33, the same number Tim Hudson has - it comes out to 67.6 VORP for the year, which would rank him 3rd in the AL.
Mulder had all the other stuff voters look for too. He had 15 wins when he went down with the hip injury and, despite not pitching in over a month, he still leads the American League in complete games with 9. I think it's pretty likely that, had Mulder stayed healthy, he would have reached 20 wins and well over 220 innings, which probably would have gotten him the Cy Young award. Of course, we'll never know for sure.
While Mulder put up those numbers despite a serious injury taking a chunk out of his season, Johan Santana deserves some credit for putting up his numbers (10th in VORP, 13th in WS) despite being trapped in the bullpen for half the year. Johan has made just 17 starts this season, by far the least of any of the top 10 VORP pitchers in the AL. Mulder has the next fewest starts, with 26.
Johan has a total of 47.6 VORP this year in 153.1 innings pitched, or 0.311 per inning. He has averaged 6.2 innings per start, so if you project him out to 33 starts on the year, he checks in with about 205 innings pitched. Multiply that by 0.311 per inning and you get a total VORP of 63.75, which would rank him 5th in the league. Ah, what could have been...
I have been very loud voicing my opinion that Johan Santana should have been in Minnesota's rotation since the start of the season and I believe what he has done since being "freed" (11-2 with a 2.99 ERA in 17 starts) has more than justified that opinion. At the same time, there are some who believe the Twins did a smart thing by limiting Johan's innings early in the year, the thought being that a young pitcher should be "eased" into the rotation.
Now certainly, I am a big believer in being careful with young pitchers. At the same time, there is a gigantic difference between putting a young pitcher into the starting rotation and abusing him, and simply putting a young pitcher in the starting rotation, period.
A.J. Burnett didn't blow out his elbow because he was in the starting rotation at a young age. He blew out his elbow because the Marlins let him throw a billion pitches every time he took the mound. I don't think there is any more danger in allowing a young pitcher to start a game every 5 days than there is keeping a young pitcher in the bullpen, where he'll warm up several times a week, come into games without much notice and often pitch several days in a row.
That's not to say a young pitcher shouldn't begin his major league career in the bullpen, because I still think that's a good idea. But in Santana's case, he had already done plenty of that in 2000, 2001 and 2002.
Basically, what I'm saying is that Santana is Minnesota's best pitcher and if a team's best pitcher is able to start, he should be in the starting rotation. I would much rather have a 24 year old pitcher with several hundreds innings of major league experience pitching every fifth day under a careful pitch-count than I would having him in the bullpen, where he doesn't know when he'll pitch, how often he'll pitch or how long he'll pitch for. I was never advocating sticking Santana in the starting rotation and letting him throw 130 pitches a start and I think that is an important distinction to make.
Okay, let's get to the contenders...
The majority of the media attention regarding the AL Cy Young this year seems centered on Roy Halladay and Esteban Loaiza. Of course, that's not surprising, partly because both pitchers have been very good this season, but mainly because they have 21 and 19 wins respectively and we all know how much baseball writers love wins.
Lost in all of that is the fact that Pedro Martinez (remember him?) is 4-0 with a 0.90 ERA in September, lowering his season ERA to a Pedro-esque 2.25. That is 22% better than the next best ERA in the AL.
To me, a pitcher should be judged primarily on two things:
1) Preventing Runs
2) Pitching Innings
How many innings can a pitcher be responsible for and how good is he at not allowing the other team to score. Most of the other stuff - strikeouts, walks, home runs, hits - is secondary, and that list of secondary stuff includes wins and losses.
All a pitcher can do is pitch innings and keep runs off the board. He can't be responsible for how many runs his teammates score for him and he can't be responsible for the support he gets from his bullpen, both of which are massive factors in a pitcher's wins and losses. So, I essentially ignore "Ws" and Ls" and instead look at "IP and "ERA."
Here is how the candidates match up in those two categories:
               IP      ERA

Martinez    183.2     2.25

Hudson      233.0     2.74

Loaiza      213.0     2.92

Halladay    257.0     3.22
Pedro has a huge edge in preventing runs, but he has not thrown nearly as many innings as the other three guys, particularly Halladay and Hudson.
Halladay has thrown by far the most innings in the AL, but he also has the highest ERA of those four pitchers. Hudson has the second-best ERA and the second-best innings total, while Loaiza ranks third in both stats.
One interesting way to look at these four pitchers is to try to determine what added value goes along with Halladay's advantage in innings. One way to do that is to look at Martinez, Hudson and Loaiza, and see what additional contributions they would have to make to match Halladay's innings and ERA totals of 257 and 3.22. In other words, if you took Halladay's contributions to the Blue Jays and replaced them with Pedro's or Hudson's or Loaiza's, what would Toronto be missing?
Pedro Martinez


               IP      ERA

Halladay    257.0     3.22

Martinez    183.2     2.25

--------------------------

Missing      73.1     5.66
By replacing Halladay with Pedro Martinez, the Blue Jays would be missing 73.1 innings worth of pitching, with an ERA of 5.66. Without Halladay, the rest of Toronto's pitching staff has a cumulative ERA of 5.06, so it doesn't seem as though it would have been too difficult to find another 73.1 innings of 5.66 ERA pitching, although certainly it may have been a problem.
Tim Hudson


               IP      ERA

Halladay    257.0     3.22

Hudson      233.0     2.74

--------------------------

Missing      24.0     7.88
In order for Hudson to match Halladay's exact production, he would have to have pitched an additional 24 innings this year, with a 7.88 ERA. It seems fairly obvious that the Blue Jays would have no problem finding pitchers to produce at least that well over the course of 24 additional innings.
Esteban Loaiza


               IP      ERA

Halladay    257.0     3.22

Loaiza      213.0     2.92

--------------------------

Missing      44.0     4.40
In this case, the production the Blue Jays would have lost by replacing Halladay with Loaiza is actually fairly valuable. They would need to find an additional 44 innings of 4.40 ERA pitching, which is definitely easier said than done.
Roy Halladay has been a tremendous workhorse for the Blue Jays this year and I do think there is value in him being able to actually pitch those additional innings, even if they carry ERAs of 4.40, 5.66 or even 7.88. That said, an edge of 24 innings, which is what Halladay has over Hudson, is not that valuable when it comes along with an ERA that is nearly 18% higher than Hudson's. In other words, if you team Hudson up with a guy who can pitch 24 innings with a 7.88 ERA, they will combine to give you Halladay's production this year. You give me Hudson's production and I think I'll take my chances finding someone who can do better than a 7.88 ERA in two dozen innings.
In comparing Halladay to Loaiza however, I do think Halladay's additional production (44 innings with a 4.40 ERA) is better pitching than you could realistically expect to be able to find with no problems.
With Pedro, the question is a little tougher to answer. Finding 73.1 additional innings is a difficult task, although certainly every team has guys in Double-A and Triple-A who could fill the role. But is it a certainty that a team would have no problem finding those 73.1 innings from pitchers who could pitch better than a 5.66 ERA? Likely? Yes. A certainty? I don't think so.
Another factor in any close award race is the ballparks each player played in. Pedro, Halladay and Loaiza all pitched in good hitter's ballparks, while Hudson pitched in an environment that is friendly to pitchers. In addition to that, the four pitchers faced different quality of opponents.
For example, Loaiza made 6 starts against the Tigers and just 1 each against New York, Boston and Toronto (the top 3 run-scoring teams in the AL). Meanwhile, Halladay made only 3 starts against Detroit and faced Boston and New York a total of 11 times. Pedro got just 2 starts against the Tigers and only 1 start against Toronto, but faced the Yankees 4 times. Tim Hudson got to pitch against Detroit just 3 times and faced the offensive-machines in the AL East a total of 6 times.
Thanks to Baseball Prospectus, we can get a very clear picture of the quality of hitters each pitcher has faced this season:
             AVG      OBP      SLG      OPS

Loaiza      .261     .327     .411     .738

Martinez    .262     .329     .415     .744

Hudson      .264     .335     .418     .753

Halladay    .265     .336     .430     .766
Not surprisingly, with a total of 11 starts against the two best offenses in the American League, Roy Halladay has faced the toughest competition this season. He has faced batters with a combined OPS of .766, which nearly 30 points higher than the batters Loaiza has faced and is significantly better competition than Pedro faced also.
In the end, my vote came down to a few different things...
1) Halladay's edge in innings is significant and I believe it gives him a definite edge over Esteban Loaiza, particularly when you consider the differences in quality of the batters each of them has faced.
2) Halladay's innings edge over Pedro Martinez is huge, but the difference in production is not all that impressive (73.1 IP/5.66 ERA). I do feel as though Halladay should be given credit for actually pitching those extra 73.1 innings with a 5.66 ERA however, and that, along with his higher quality of batters faced, gives him the edge over Pedro.
3) Essentially, it comes down to Halladay and Hudson. Hudson is second in the AL in innings pitched, just 24 behind Halladay. Halladay pitched those "extra" 24 innings with a 7.88 ERA, which certainly makes his lead in innings seem anything but impressive. That said, Hudson has done his pitching in a good pitcher's ballpark and his quality of batters faced is slightly less than Halladay's. In the end however, I don't think Halladay's 24 inning advantage, along with park factors and batters faced differences, is enough to make up for Hudson's significantly better ERA.
This is an extremely close race, one through four, but I give my vote to Tim Hudson, very narrowly over Roy Halladay, Pedro Martinez and Esteban Loaiza.
National League Cy Young:


1) Mark Prior, Chicago Cubs
2) Jason Schmidt, San Francisco Giants
3) Kevin Brown, Los Angeles Dodgers
4) Eric Gagne, Los Angeles Dodgers
5) Brandon Webb, Arizona Diamondbacks
                    VORP                         Win Shares

Jason Schmidt       67.1        Eric Gagne          23.33

Mark Prior          62.0        Mark Prior          21.41

Brandon Webb        60.5        Jason Schmidt       21.27

Kevin Brown         56.9        Livan Hernandez     21.06

Livan Hernandez     56.3        Javier Vazquez      19.48

Javier Vazquez      51.9        Billy Wagner        18.89

Hideo Nomo          49.7        Brandon Webb        18.54

Kerry Wood          49.3        Kevin Brown         18.33

Curt Schilling      48.8        Carlos Zambrano     17.98

Carlos Zambrano     46.4        Hideo Nomo          16.65
In order to decide who you think the best pitcher in the National League has been this season, I think you must first figure out which starting pitcher you think has been the best, and then compare that player to Eric Gagne.
So let's do that...
With all due respect to Brandon Webb (my NL Rookie of the Year), I think the title of "Best Starting Pitcher in the National League, 2003" comes down to Jason Schmidt, Mark Prior and Kevin Brown. They rank 1-2-4 in VORP, 1-2-6 (among starters) in Win Shares, and they are 1-2-3 in ERA.
Let's compare:
           GS        IP     ERA     W    L    SO9    BB9    HR9    OAVG   SO/BB

Schmidt    28     207.2    2.34    17    5    9.0    2.0    0.6    .200     4.5

Prior      29     204.2    2.42    17    6   10.3    2.1    0.6    .230     4.9

Brown      31     204.0    2.43    14    9    8.0    2.3    0.5    .236     3.5
First of all, Prior and Schmidt has eerily similar numbers. They both have 17 wins. Schmidt has 5 losses, Prior has 6. Schmidt has 207.2 innings, Prior has 204.2. Schmidt has a 2.34 ERA, Prior has a 2.42 ERA. Schmidt has walked 2.0/9 IP, Prior has walked 2.1/9 IP. Schmidt has 4.5 strikeouts for each walk, Prior has 4.9.
It's damn near impossible to separate the two of them looking at those numbers. Fortunately, there is a fairly significant factor involved that doesn't show up there. Jason Schmidt pitches his home games in the best pitcher's park in the National League, while Mark Prior pitches his home games in Wrigley Field (which is actually a slight pitcher's park, despite its reputation). Certainly the differences in environments are not huge, but when two players are this close, it is enough to at least give one the edge over the other.
Kevin Brown also pitches in a great pitcher's ballpark, which also takes him down a notch compared to Prior. I think it comes down to Schmidt versus Prior and the home ballparks are probably enough to give Prior just a slight edge. Another thing to consider and another thing that goes in Prior's favor is the quality of batters they have faced:
             AVG      OBP      SLG      OPS

Schmidt     .258     .328     .403     .731

Prior       .257     .331     .413     .743
The difference here isn't nearly as big as the gap between Loaiza and Halladay, but it's still important to look at. Prior's opponents have had a slightly higher on-base percentage and a slugging percentage about 3% higher. That, along with the ballparks, is enough to put Prior ahead of Schmidt, although the margin is incredibly small and I could certainly see an argument either way.
But okay, I'm going to take Prior as the top NL starter, so let's compare him to Eric Gagne, like I suggested earlier...
The real question is whether you would rather have 204.2 innings of 2.42 ERA pitching at the beginning and middle of games, or 79.1 innings of 1.25 ERA pitching at the end of games?
Personally, I'll go with the bulk innings just about every time, and that's the case even while admitting that Eric Gagne has had one of the most dominating handful of seasons in the history of the sport. But 79 innings is still just 79 innings, no matter how dominating they are and no matter how many of them come in crucial situations.
Let's say you think, and I would tend to agree, that Gagne's innings were more important on an inning-by-inning basis than Prior's innings. Let's even go so far as to say those innings were 50% more important, which gives Gagne credit for 118.2 "adjusted innings" (79.1 x 150%). I'm not saying I agree with this reasoning, but bear with me.
Now the question becomes, would you rather have 118.2 innings of 1.25 ERA pitching, or 204.2 innings of 2.42 ERA pitching? To me, the answer is still very clear.
Let's do the same thing we did with Halladay and the AL contenders. Let's take Prior's 204.2 innings and 2.42 ERA and find out exactly what Gagne would have to "add" to his season (using those same "adjusted innings") in order to match Prior's production:
                     IP      ERA

Prior             204.2     2.42

Gagne x 150%      118.2     1.25

--------------------------------

Missing            86.0     3.97
In other words, even by adjusting Gagne's numbers generously because of the importance of his late-game work, there is still a difference of 86 innings of 3.97 ERA pitching.
Chicago's team ERA with Prior excluded is 4.10 this season, so I think it is a lot to assume they would be able to find someone capable of pitching an additional 86 innings with a 3.97 ERA, to fill the void if Gagne replaced Prior. And again, that is all with Gagne receiving 150% credit for his actual production, which is not something I feel he should get.
I think what this season shows is not that Eric Gagne has been anything but extraordinary, but that a closer simply does not pitch enough innings to compete with a great starting pitcher, even when that closer has had one of the most dominating seasons in baseball history, and even when you make extreme adjustments for possible added value that the closer's work in the late innings of games brings.
If there weren't any dominant seasons by an NL starting pitcher this season, I think Gagne might possibly deserve more serious consideration. Unfortunately for him, not only has there been a dominant season by an NL starting pitcher this year, there have been at least three of them. In the end, I'll take those three dominant starters over the extraordinary closer, and rank em Prior, Schmidt, Brown, Gagne.
Finally...
Keep in mind that these are my choices for the awards, not predictions for whom I think will actually win them. I would guess that Roy Halladay and Eric Gagne will come away with the awards when the people who actually have a vote get their say. In the meantime, here is a little something to chew on...
Over the last 10 years (1993-2002), there have been 20 Cy Young award winners. The league leader in which of the following stats won the most of those 20 Cy Youngs?
a) Wins
b) ERA
c) Innings
d) Adjusted ERA+
Go ahead, make a guess.
Before I crunched the numbers, I would definitely have guessed wins. And I would have been wrong.
Believe it or not, the league leader in adjusted ERA+, a "sabermetric" stat that the majority of Cy Young voters probably have never even heard of, won 13 of those 20 Cy Youngs.
The league leaders in regular, unadjusted ERA came in second with 12/20. The pitchers who led their league in wins won 10/20 and the pitcher with the most innings pitched in the league won just 8/20. There is, as you can see, quite a bit of "overlap" (for example, one pitcher could win a Cy Young while leading the league in all 4 stats), but the results are pretty interesting nonetheless.
Thanks for stopping by today and make sure to stop back tomorrow for my look at the biggest award of them all.
Oh yeah, I almost forgot...
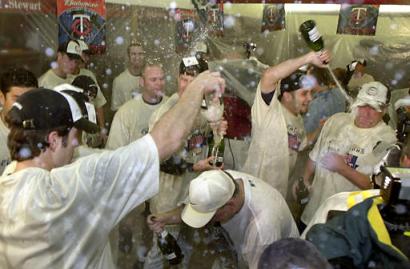
Your back-to-back American League Central champs
Link of the Day:
The Cub Reporter - "Living and dying with the Cubs since July, 2001"
Today's picks:
Philadelphia (Myers) +135 over Florida (Beckett)
Total to date: + 3,195
W/L record: 241-236 (1-0 yesterday for +100.)
*****Comments? Questions? Email me!*****

